KATHMANDU: The Department of Customs has released the latest trade statistics, indicating significant figures for Nepal’s imports and exports over the past month and the first 11 months of the current fiscal year.
May 14 to June 14, 2024:
Imports: Nepal imported goods worth Rs. 150.35 billion.
Exports: Nepal exported goods worth Rs. 13.09 billion.
First 10 Months of Fiscal Year 2023-24:
Imports: Goods worth Rs. 1,303.35 billion were imported.
First 11 Months of Fiscal Year 2023/24:
Imports: Goods worth Rs. 1,453.70 billion were imported.
Exports: Goods worth Rs. 139.26 billion were exported.
Foreign Trade: Total foreign trade amounted to Rs. 1,592.96 billion, a 1.95% decrease compared to the same period last fiscal year.
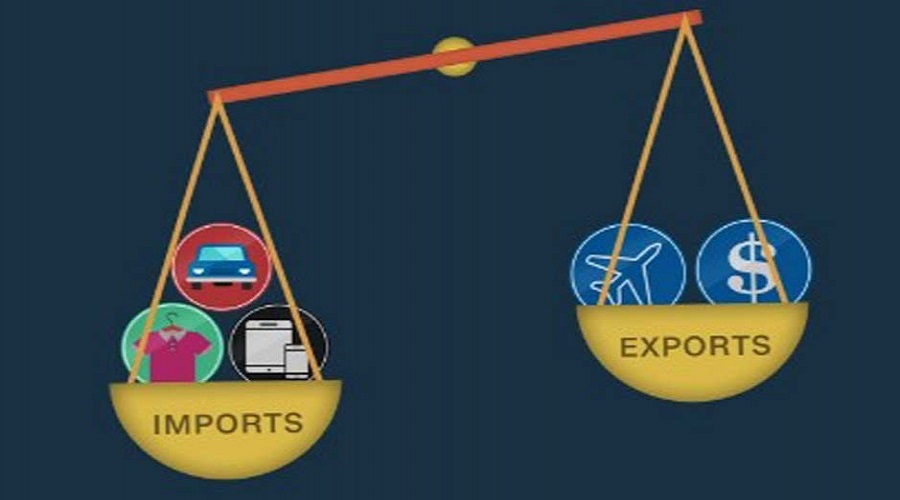
Trade Deficit: The trade deficit stood at Rs. 1,314.44 billion, a 1.72% reduction from the Rs. 1,337.39 billion deficit recorded in the same period last fiscal year.
Import-Export Ratio: The ratio of import to export was 1:10.44, slightly higher than last year’s 1:10.31.
Comparative Analysis:
Imports Decline: Imports decreased by 1.84% from Rs. 1,480.98 billion in the previous fiscal year to Rs. 1,453.70 billion.
Exports Decline: Exports decreased by 3.01% from Rs. 143.58 billion in the previous fiscal year to Rs. 139.26 billion.
Key Export and Import Figures:
Soybean Oil: Exported Rs. 875 million, down from Rs. 8.47 billion last year.
Palm Oil: Exported Rs. 6.31 billion, down from Rs. 19.54 billion last year.
Sunflower Oil: Exported Rs. 160 million, down from Rs. 400 million last year.
Cement and Clinker: Exported Rs. 3.65 billion.
Tea and Coffee: Exported Rs. 3.29 billion.
Carpet: Exported Rs. 9.76 billion.
Cardamom: Exported Rs. 7.47 billion.
Crude Soybean Oil: Imported Rs. 13.02 billion.
Crude Palm Oil: Imported Rs. 12.42 billion.
Sunflower Oil: Imported Rs. 15.68 billion.
Petrol: Imported Rs. 62.87 billion.
Diesel: Imported Rs. 129.02 billion.
Kerosene: Imported Rs. 1.19 million.
Aviation Fuel: Imported Rs. 19.47 billion.
Liquefied Petroleum Gas: Imported Rs. 51.07 billion.
Maize: Imported Rs. 14.08 billion.
Rice and Paddy: Imported Rs. 21.13 billion.
Wheat: Imported Rs. 8 billion.
Electric Vehicles (including three-wheelers): Imported Rs. 30 billion.
Implications:
– The decline in both exports and imports contributed to a decrease in overall foreign trade.
– The reduction in the export of key commodities like soybean oil and palm oil significantly impacted overall export figures.
– Despite a reduction in the trade deficit, the country’s heavy reliance on imports continues to pose challenges for economic stability.
The ongoing trade trends underscore the need for strategic economic policies to boost exports, reduce dependency on imports, and improve the overall trade balance.

